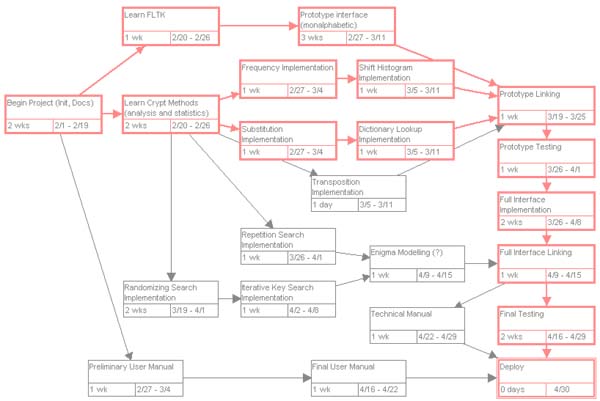
A PERT (Program Evaluation Review Technique) chart is used to organize and schedule tasks within a project. The chart shows various tasks and milestones as circular nodes in a network diagram (see below). The arrows between nodes (tasks or milestones) represent the dependencies between tasks. This chart is preferred over the Gantt chart because it shows dependencies and tasks that can be executed in parallel or independent of each other. A PERT chart, therefore, shows more information and can be quite useful in planning projects. However, due to the complexity inherent in representing these dependencies between all tasks and milestones, this can become a tedious exercise.
Back to Project Management and Concepts Glossary
Related Posts
Definition: Project Management
Definition: Project Management Office (PMO)
— End